the edge of chaos
this week seed had a fun article on complexity that was also just visually stunning. i've been thinking a lot about the visualization of data lately, between having to generate a slide for a talk (which i haven't done) and getting the latest eye candy from tufte.
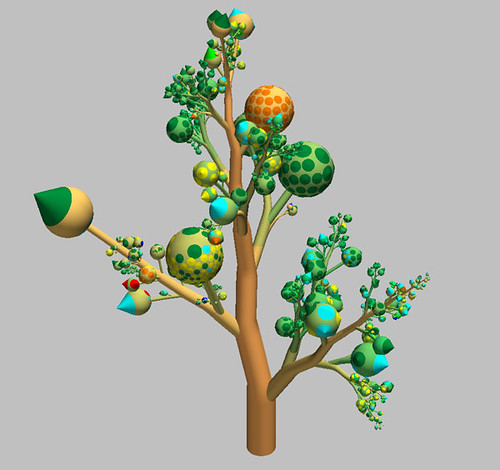
this botanical hierarchy was my favourite out of all the ones on seed, at least partly because it reminds me of the work of henry and still henry but not.
"When we observe botanical trees, we find that the leaves, branches and their arrangement can often easily be extracted, in spite of their very large numbers," says author Huub van de Wetering. "What would happen if we try to visualize hierarchical data as botanical trees?"
Wetering's group at Holland's Eindhoven University of Technology mapped hierarchical data to three-dimensional trees with branches and leaves representing files and directories. Groups of leaves are shown as fruit.
from seed
i also like that the other images are of networks, which by the way, is actually what this was all about (plus some other details)
posted by thixotropic @ 12:25 PM
![]()
![]()

0 Comments:
Post a Comment
<< Home